Archive for the 'Kids’ Related Research' Category

Friday, November 1st, 2013

Summarizing “Zero to Eight Children’s Media Use in America 2013″

[The following is an article I wrote for the November 2013 issue of Children’s Technology Review. A PDF copy of the article from this magazine can be downloaded here.]

A photo of Vicky Rideout from an earlier 2013 presentation

For those of us that work in children’s media, there’s nothing like finding a fresh, data filled report.

Zero to Eight Children’s Media Use in America 2013” is Vicki Rideout’s latest in a series of reports commissioned by Common Sense Media. Having followed Vicky’s work for more than a decade, I asked her for an overview of her findings.

The first key finding is this: Television and video game use is down for children compared to just two years ago. (Yes, down, not up!) In addition, overall screen media use is down compared to what was recorded just two years ago.

Television viewing in the bedroom is also down by a sizable amount. As with the television and video game drop Vicky says “I’d like to look back on these data points from a future report to see if this is a bump or a trend.” This finding does beg some additional questions that cannot be answered through the report, like has there been a drop in the number of televisions owned in the home? Has the drop in television viewing in the bedroom shifted to video viewing on a tablet in the bedroom? Vicky says it is too early to tell if this is a trend.

According to Rideout “Little drops in each platform add up to a half hour of less screen time per day on traditional screens. Then when you add in the increase in mobile use it brings that number down to 20 minutes less screen time per day. While this drop in overall screen time is significant and noteworthy, I’d like to see what the research says in another two years.”

There’s a lot of material in this report about tablet and related mobile media use. For example, two years ago only 8% of parents owned a tablet. “Today it’s 40% and children’s tablet ownership is nearly similar to that of their parents from the 2011 report. Years ago handheld video game manufacturers noted that when an older sibling purchased a new handheld gaming device, a younger sibling would ultimately receive the older device. Could the same thing be happening here with parents purchasing a new tablet and giving the children their old one? This report can’t answer that question specifically, but one thing is clear: Tablet ownership by children will increase in the years to come.

Another key trend: there is a giant shift in media use, and “the tablet is a game changer.” Vicky told me that there is “some computer use among young children, starting as early as four years of age, but because the tablet has simplified the interface so much and made things so intuitive, we see really young children successfully using this platform. If a one or two year old child can turn the pages of a board book, that same child can touch and swipe a tablet. If that child can point to an image on a board book, then that child can launch an app. As a result, a large world of content is made available to these young children. The floor for how young children use this platform has gone way down compared to other technological innovations, even compared to the Wii, which was a huge leap forward in terms of intuitive use and interface deign.”

In addition Vicky notes: “People keep saying how children are so technologically smart. We have that notion backwards. It’s the technology that’s become smart, so smart that a kid, or even a baby can use it. This change is also opening up access to content that is not just about passive video watching.

“People keep asking me ‘Is this a good thing or a bad thing?’ Unless you believe that a screen per se is a bad thing for kids no matter what, I usually respond that this is just a thing, it’s just a tablet. The good or bad about a tablet depends on the quality of the content you share with a child through this new medium.”

Vicky’s comments just begin to scratch the surface of what’s included in this new report. However, Vicky also shared she is working on a new report, focused on the same zero to eight demographic, but this time she’s writing it for the Joan Ganz Cooney Center. This report will take a deep dive into educational media, eBooks, and joint media engagement (a fancy term for parents who share in the same media experience with their child). The scheduled date of release is January 23, 2014. We look forward to reading more!

Related links:

Zero to Eight: Children’s Media Use in America 2013
Common Sense Media

VIDEO – Parenting in the Age of Digital Technology – Vicky Rideout interview (2013)
360KID

Parenting in the Age of Digital Technology (2013)
Northwestern University


VIDEO – Vicky Rideout interview – Zero to Eight Children’s Media Use Research Overview (2011)

360KID

Zero to Eight: Children’s Media Use in America (2011)
Common Sense Media

Generation M2: Media in the Lives of 8- to 18-Year-Olds (2010)
Kaiser Family Foundation


Generation M: Media in the Lives of 8-18 Yr-olds (2005)

Kaiser Family Foundation

The Effects of Electronic Media on Children Ages Zero to Six: A History of Research (2005)
Kaiser Family Foundation

Zero to Six: Electronic Media in the Lives of Infants, Toddlers and Preschoolers (2003)
Kaiser Family Foundation

Kids & Media @ The New Millennium (1999)
Kaiser Family Foundation

Average Rating: 5 out of 5 based on 247 user reviews.

Tuesday, September 3rd, 2013

How 360KID uses Facebook to find kid testers to improve their digital creations and apps.

This has been a busy year of development for my company. We’ve been creating multiple interactive products for kids. Some are learning apps, some are online games, some electronic toys. Some are for preschoolers, some for tweens. All of them have one thing in common. The completed products must successfully engage kids. In an effort to make sure we are making the best interactive products possible, we need to test our ideas with children. When I say “we” I mean the larger kids industry, not just my company. For those who develop any kind of product or media for kids (especially all those children’s app developers out there! I’m talking to you!) you MUST kid test your products. Get your software builds, your animations, your web games, your characters, your paper prototypes out there in front of real kids! Do not go to market without testing your assumptions, you may find you had it all wrong. Testing is an invaluable part of children’s media development and should be part of every product you make if you work in the kids biz.

There are a number of ways to recruit kids for testing. You can reach out to family and friends, kids in your neighborhood. However, sometimes you need to reach out beyond your known circle and find kids from another location; say kids that live in a city, or bilingual preschoolers, or eight to ten year olds that belong to Girl Scouts, or tweens that like to play baseball. What do you do then?

While you can reach out to specific youth groups, Boys and Girls Clubs, and other kid-focused organizations, you can also use Facebook. Now I know you’re saying “What?! Facebook? For recruiting kid testers? Are you crazy?!” As with all kid testing, you’re starting a conversation with a parent, and recruiting through Facebook means you are looking to have a conversation with a parent about kid testing.

Here’s a more detailed look at one kid testing ad campaign we placed on Facebook. We started by selecting a particular town we wished our testers to come from. The 10 mile radius around that town had 168, 000 parents using Facebook. Selecting a thinner slice from that group, parents with children ages 4 to 12 resulted in 1, 400 Facebook users. When you start a Facebook ad, you can get very specific about the kind of person you wish to reach. Do you want to reach just men 25 years of age or older? How about just women with a PhD? All of this is possible to define in your campaign. However, the more specific you get with your target demographic, the smaller your audience will become.

We posted an ad for kid testers for 45 days, with a maximum bid of $2.50 per click, not to exceed a cost of $50 a day. Our ad appeared over 712, 000 times (impressions), reaching more than 8, 200 Facebook users in our target age and location (demographic), resulting in a click-through rate (CTR) of 427. We heard from about 45 parents, leading to 22 parents bringing in 30 children, all for a total cost of $560, or about $1.30 per click.

Another way to look at our recruiting costs: $25 per parent or about $19 per child. This was just our advertising cost and did not include email communication time, phone calls, testing time, analysis of results, or the stipend we offered a parent for having their child come in to test with us.

Was it worth it? Yes, in the end Facebook definitely helped us find kids from a specific geo-targeted location to test with.

Was it perfect? Hardly. There were many frustrating parts to working with Facebook. First time advertisers will be annoyed that once you place an ad, it can take many days before your campaign is approved and goes live. While you’re waiting, all you can do is think about what you did wrong and why your ad is not producing. During this time you’ll probably change your ad copy and up the daily maximum bid thinking it will help. But hold tight, Facebook is just being Facebook. It takes time for an ad to kick in, and you will receive next to no communication from Facebook while you are pulling out your hair, wondering what’s going on.

Were there any surprises? You bet. While many parents found our ad on Facebook, there were some “uber parents” that helped spread the word around their neighborhood that we were looking for kid testers. About four parents that came in were in this category. They were great at helping reach many more parents, including non-Facebook users as well.

In the end we met many great parents with some wonderful kids. All of which helped us refine our product and made it better. We couldn’t be happier, and our finished product shines as a result of the feedback we incorporated back into development! Thank you parents and our 360KID testers!

Bottom line: It doesn’t matter how you find kids to test with, using Facebook or some other means, what matters is that you test! Doing so will only help make your product shine, stand out from the pack, and lead to more successful interactions through your product with kids. Now get out there and start testing!

Average Rating: 4.9 out of 5 based on 200 user reviews.

Tuesday, August 27th, 2013

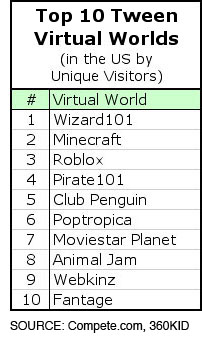
The Top 10 Tween Virtual World and MMO destinations which include Wizard 101,  Minecraft,  Roblox,  Pirate101,  Club Penguin,  Moviestar Planet,  Poptropica,  AnimalJam,  Webkinz,  Fantage

It’s been a little while since I’ve posted some data on the virtual world space for tweens. I’ve been curious about a number of worlds and how they have been doing. Some questions that have been on my mind; How has Wizard101 been doing since the launch of it’s newer Pirate101 property? Has Roblox been growing and how has it’s traffic been in comparison to Minecraft? How have the Marvel and Star Wars designs worked out for Club Penguin? These are just a few questions, but what often happens as you start tabulating the data, may more questions start to emerge, along with some interesting findings. Let’s take a look.

A few immediate observations (see chart below). Wizard101 is crushing it! Their unique visitor stats (“uniques”) are off the charts! The big question I’ve had for the last year or so, can KingsIsle maintain it’s growth with two virtual worlds instead of eroding traffic from one to give to the other? In the first six months of Pirate101 it looked like Pirate was cannibalizing traffic from Wizard. Not so for the last three months. Both worlds appear to be growing in traffic very nicely together, and it appears without any cannibalization.

Chart - Top 10 Tween Virtual Worlds Comparing Unique Visitor Data
Chart 1 – Top 10 Tween Virtual Worlds – Comparing Unique Visitor Data. (Click image to see larger version of the chart.)

Another finding, it looks like unique traffic to Roblox has been following Minecraft’s growth pretty evenly. Roblox edged out Minecraft this past December and May, just a wee bit, and now they are neck-and-neck for the month of July.

While Poptropica’s numbers are still very nice, we’re not seeing the usual summertime climb in traffic. I find this a little odd.

Similar flat growth for Club Penguin during this summer, but they broke an all time record this past April, reaching the highest level of traffic ever in their history! The December before they also broke that record. Some nice high numbers, which I would also expect to see in July again.

Animal Jam continues its very steady slow climb. Always nice to see the upward trend here, even if it is small. Slow and steady wins the race!

What’s also interesting about Chart 1 is what it does not say. For the month of July Moshi Monsters didn’t place in the Top 10. Neither did MonkeyQuest, or for that matter the other two Viacom worlds as well, including PetPet Park and NeoPets. (More on Moshi in a moment.)

Chart - Top 10 Tween Virtual Worlds - Cumulative Unique Visitor Data
Chart 2 – Top 10 Tween Virtual Worlds – Cumulative Unique Visitor Data. (Click image to see larger version of the chart.)

From December 2011 to December 2012 unique traffic almost doubled to 50 million uniques across these ten worlds. The cumulative traffic for July 2013 is just over 55 million uniques! Compare that with July 2011’s numbers of just about 21 million uniques and you can see the overall growth in the tween virtual world space. However, the majority of the growth appears to be coming from Wizard101, Minecraft, Roblox, and Pirate101.

Chart - Top 10 Tween Virtual Worlds - Cumulative Unique Visitor Data
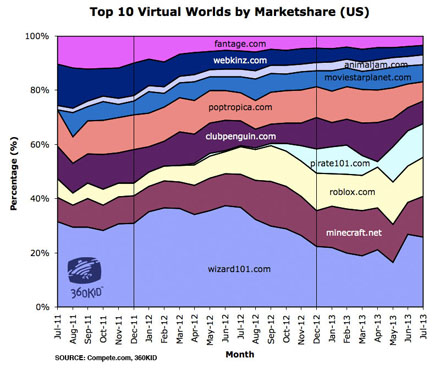
Chart 3 – Top 10 Tween Virtual Worlds – Percentage of Marketshare based on Unique Visitor Data. (Click image to see larger version of the chart.)

This marketshare chart above demonstrates how Wizard101, Pirate101, Minecraft and Roblox control almost 60% of the uniques combined for tween virtual worlds in the US. You can also notice some erosion with Webkinz and Fantage over time.

Chart - Moshi Monsters - Lifetime Unique Visitor
Chart 4 – Moshi Monsters – Lifetime Unique Visitor. (Click image to see larger version of the chart.)

Now let’s take a deeper look at Moshi Monsters. Why didn’t they place in the Top 10? The chart above shows the lifetime uniques for the destination within the US, more than five and a half years of data. You will notice that Moshi had a really great spring. Huge traffic! However, that traffic almost evaporated during the last two months. Let me remind you, the summer months in the US are a time for big numbers, not small. When this happens the first thing I often question is the validity of the Compete data for those months. The trouble is I’ve been using Compete for so long I’ve noticed they rarely get two months of back-to-back data wrong. It could happen, but I’m doubtful that’s the problem. Whatever the reason, it is a surprise to see after such a stellar rise in the spring.

These are just a few of the many stories that could be told with this data. There are many more stories to be told when you look at the data together with the hundreds of other worlds I follow as well. Especially when you break out the data by category (casual gaming, creative expression, education, sports, etc.) Do you see anything of interest with these charts? Do you see a story that needs to be told? If so, be sure to post a response in the comments section below. Thanks for reading!

Average Rating: 4.9 out of 5 based on 226 user reviews.

Friday, August 3rd, 2012

Casual Connect is an annual conference in the US that explores the business and development of casual games. This conference also travels to Europe and Singapore. This year’s US event recently held in Seattle, had a day long track focused on Children & Family Entertainment. 360KID CEO Scott Traylor was asked to deliver a presentation on trends and best practices for developing learning games. The video below is a recording of his talk called “Technology, Kids, & Learning: The Future and the Opportunities”.

Links to specific research cited in this presentation are listed below.

Do you need help developing a learning game for the classroom or just need some advice for creating a consumer-based learning game? Be it online, offline, electronic toy, iOS or Andriod, give us a call.

Average Rating: 4.4 out of 5 based on 296 user reviews.

Thursday, April 26th, 2012

[Wendy Smolen is a contributing writer to the KidScreen blog. She is also a friend and the co-founder of the annual children’s conference called Sandbox Summit. Wendy asked if I would share some thoughts with her regarding the latest Sandbox Summit event held at MIT. Originally published to the KidScreen blog on April 25, 2012.]

Scott Traylor, Chief Kid at 360KID, had the daunting job of taping the recent Sandbox Summit@MIT, Going Mobile, Going Global, Tracking the anywhere/everywhere state of play. While this gave him a front and center seat, it also meant he had to listen to every word (no bathroom breaks!) I asked him to comment on a few of his favorite presentations.

Generally I find conferences don’t provide a helpful starting point about how kids are changing. Not so here. Allison Arling’s presentation from The Intelligence Group covered uncounted aspects of generational preferences with Gen Y and Gen Z. I found myself nodding in agreement as she communicated subtle differences in media consumption, messaging that resonates with a generation, and triggers for engagement across generational divides that can make or break any media plan. Clear, crisp, exact. (Or whatever.)

Allison’s presentation provided the scaffolding used by many of the other speakers. On day two, Jane Gould of Nickelodeon delivered a resounding kids’ media data punch . Jane always has access to great info, and she’s willing to share! Ever wonder what apps are most popular with kids, and why? What kinds of media do kids consume on tablets? What barriers will prevent media consumption on a tablet but not on television? What is consumption like on non-Apple devices? The answers were startling and maybe the most detailed and in-depth I’ve seen in the mobile/tablet/apps space ever. Jane made understanding the drivers of mobile media consumption a no-brainer.

Gaming and learning was a common thread in conversations both inside and outside the auditorium. Eric Zimmerman, game designer and industry thought leader, challenged us to rethink long-standing assumptions about learning games. Eric delivered one media mind bomb after another, the biggest being why educators challenge the value and potential for learning in games at all. Why is this one tool for creative expression challenged more than others? Why is it so many in education, as well as in business, wish to “gamify” learning? Should we have similar concerns about books in learning? Should we “bookify” learning? That’s crazy talk, and so is the current conversation about the potential games have to teach. Books are just one element of learning, why aren’t games?

These are just three small samples of a larger conversation. There’s no way I can do justice to all the intriguing thoughts each presenter brought to the conversation over the two days. If you missed attending this event, watch one—or all—of the videos here. You’ll be as amazed as I was at what you‘ll learn.

Disclosure: Scott Traylor is the founder of 360KID, a children’s interactive media company. Scott is also on the Board of Advisors for the Sandbox Summit. He captured the video being shared in this article’s links.

Average Rating: 4.6 out of 5 based on 236 user reviews.