

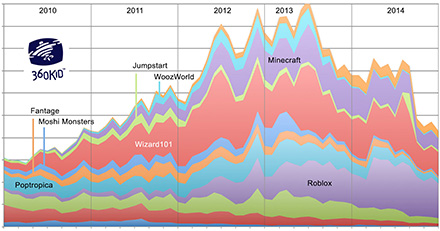
(Click image above to see larger, complete version of chart.)
![]()
In the early virtual world days, when Club Penguin and Webkinz were just beginning to be the biggest online destination for kids, I started collecting online data about those worlds. Bit by bit, month by month. Over a few years it became kind of a data archiving obsession, which also included the older NeoPets world, and in the years to come hundreds of other online destinations of interest to kids. Poptropica, WoozWorld, Jumpstart, Wizard101, Roblox, Fantage, Moshi Monsters, Minecraft, and Animal Jam to name some of the most popular virtual worlds. Over time I followed almost 600 virtual worlds that appealed to kids and occasionally some for adults. In those early days I used an online tool called Compete.com to collect my data. It was a rather inexpensive tool, and when I compared the data coming from this product to actual data shared with me by some of these virtual worlds, I found both sets of data to be surprisingly in line with each other.
Fast forward to today. A client recently asked for some historic data on successful virtual worlds for kids, in particular those destinations that are still an ongoing concern. Sadly many worlds despite their earlier success didn’t survive. (More on that in a moment.) So I brushed the dust of of my old data, added in some new data, and much to my surprise I found I had information that collectively told the story of the rise and fall of children’s virtual worlds. That is the rise and fall of many, … but not all.
If you click on the smaller first chart above you will see it will pop open a larger and more detailed chart. This larger chart compares the top 12 virtual world destinations for children over a 10 year plus period of time (2006 – 2016). It contains cumulative monthly unique traffic in the US. Unique user traffic piled on top of other virtual world traffic. You can see in the earlier years of this chart Neopets, Club Penguin, and Webkins traffic combined reached a high collectively at the end of 2007 which is about a third of all traffic you see when comparing it to the many more virtual worlds in the race by the year 2013. Virtual worlds for kids were not only growing in popularity, so too was access to the internet for children.
You will notice some lettered markers placed at the top of this chart (A, B, C, D & E). Each marker notes the growing popularity of Apple iPads over time, starting with its debut in 2010 (A). Once iPad popularity reach a tipping point in mid 2013 (D), with 55% of all 2 – 10 year olds having access to an iPad, things in the online virtual world space started to change. You will note the sizable drop in online traffic over the next two years. What happened to the success of these virtual worlds? Well, most virtual world destinations were built with an interactive authoring tool called Adobe Flash. Sadly, Flash wasn’t supported on iPads. This was intentional on Apple’s part. Whatever Apple’s reason for not allowing Flash to work on its iPads, it was a real processing hog, and back in the day it would usually be the reason your computer or laptop fan kicked on, which if you had a laptop, the fan turning on would start to drain your laptop’s battery.
Virtual worlds that were developed in Flash now had a problem. With kids migrating from desktop or laptop computer to iPads, most virtual world companies had a decision to make. That decision often involved deciding how their virtual worlds would work in another tool, and individually would these companies have the time, resources and money to migrate to another tool. Yes, there were other factors involved as the virtual world space matured, COPPA and privacy concerns for one, but the Flash development issue was a sizable problem for many and one that most couldn’t overcome. The few worlds that were able to cross this chasm were Minecraft, Roblox, Poptropica and Animal Jam. Part of their solution was to develop their virtual world products to work on the iPad, and often later Andriod tablets, while at the same time keeping an online web-based version of their products operational, even if it meant having two different technology solutions moving forward. One for web, and another for tablet.
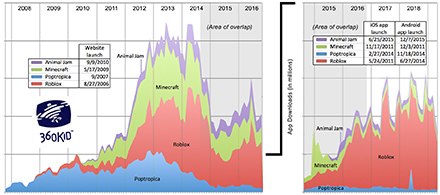
(Click image above to see larger, complete version of chart.)
![]()
This next chart, when clicked to enlarge, provides additional detail about the overlap in traffic from online uniques to app downloads, only in the US. A couple of things immediately to note. First, the app download traffic is a fraction of the online unique traffic. Online traffic for children’s virtual worlds in its heyday was collectively almost five times that of app downloads of the same product. Also, the Compete.com data ends in November 2016. Sadly Compete.com as a service shut down in December 2016. The online tool I’m using to track app downloads is Priori Data. This data does not provide the full picture of when these surviving virtual worlds originally launched their virtual worlds as an app, but the app data service App Annie does provide that information, and is included as a table on top of these charts.
When looking at the app download data it looks like Roblox is seriously beating out Minecraft. An important distinction to make about the two apps; Roblox can be downloaded for free, whereas Minecraft costs $6.99 to download. Minecraft users have to pay to use the app from day one. Roblox users can try before they buy, though users might enjoy the experience more with in-app purchases. This is also true for Animal Jam and Poptropica, where you can download a freemium version of the app, and convert to a paid monthly subscription after trying out the product or simply purchase in-app items.
If you have any insights to share about this data, or you have any questions, please send me an email. I look forward to hearing from you!
Additional references for the first chart:
Rideout, V. J. (2011). Zero to eight: Children’s media use in America (p. 19, 21). San Francisco, CA: Common Sense Media. (click to view).
Rideout, V. J. (2013). Zero to eight: Children’s media use in America 2013 (p. 9, 20). San Francisco, CA: Common Sense Media. (click to view).
Rideout, V. J. (2014). Learning at home: Families’ educational media use in America (p. 18, 19). A report of the Families and Media Project. New York: The Joan Ganz Cooney Center at Sesame Workshop. (click to view).
Rideout, V. J. (2015). The Common Sense Census: Media Use by Tweens and Teens (p. 22). San Francisco, CA: Common Sense Media. (click to view).

