

Tuesday, August 27th, 2013
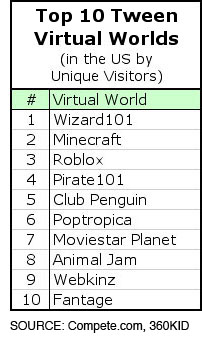
It’s been a little while since I’ve posted some data on the virtual world space for tweens. I’ve been curious about a number of worlds and how they have been doing. Some questions that have been on my mind; How has Wizard101 been doing since the launch of it’s newer Pirate101 property? Has Roblox been growing and how has it’s traffic been in comparison to Minecraft? How have the Marvel and Star Wars designs worked out for Club Penguin? These are just a few questions, but what often happens as you start tabulating the data, may more questions start to emerge, along with some interesting findings. Let’s take a look.
A few immediate observations (see chart below). Wizard101 is crushing it! Their unique visitor stats (“uniques”) are off the charts! The big question I’ve had for the last year or so, can KingsIsle maintain it’s growth with two virtual worlds instead of eroding traffic from one to give to the other? In the first six months of Pirate101 it looked like Pirate was cannibalizing traffic from Wizard. Not so for the last three months. Both worlds appear to be growing in traffic very nicely together, and it appears without any cannibalization.
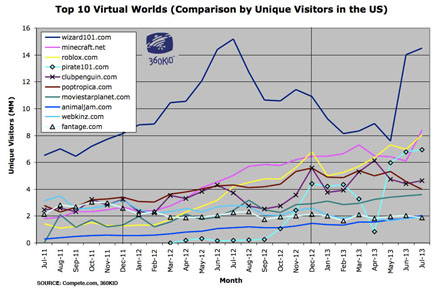
Chart 1 – Top 10 Tween Virtual Worlds – Comparing Unique Visitor Data. (Click image to see larger version of the chart.)
Another finding, it looks like unique traffic to Roblox has been following Minecraft’s growth pretty evenly. Roblox edged out Minecraft this past December and May, just a wee bit, and now they are neck-and-neck for the month of July.
While Poptropica’s numbers are still very nice, we’re not seeing the usual summertime climb in traffic. I find this a little odd.
Similar flat growth for Club Penguin during this summer, but they broke an all time record this past April, reaching the highest level of traffic ever in their history! The December before they also broke that record. Some nice high numbers, which I would also expect to see in July again.
Animal Jam continues its very steady slow climb. Always nice to see the upward trend here, even if it is small. Slow and steady wins the race!
What’s also interesting about Chart 1 is what it does not say. For the month of July Moshi Monsters didn’t place in the Top 10. Neither did MonkeyQuest, or for that matter the other two Viacom worlds as well, including PetPet Park and NeoPets. (More on Moshi in a moment.)
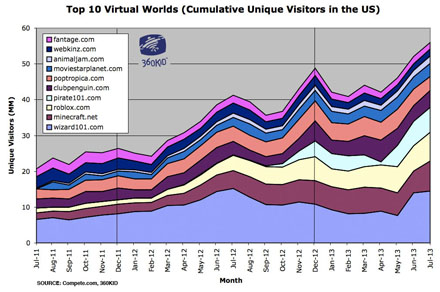
Chart 2 – Top 10 Tween Virtual Worlds – Cumulative Unique Visitor Data. (Click image to see larger version of the chart.)
From December 2011 to December 2012 unique traffic almost doubled to 50 million uniques across these ten worlds. The cumulative traffic for July 2013 is just over 55 million uniques! Compare that with July 2011’s numbers of just about 21 million uniques and you can see the overall growth in the tween virtual world space. However, the majority of the growth appears to be coming from Wizard101, Minecraft, Roblox, and Pirate101.
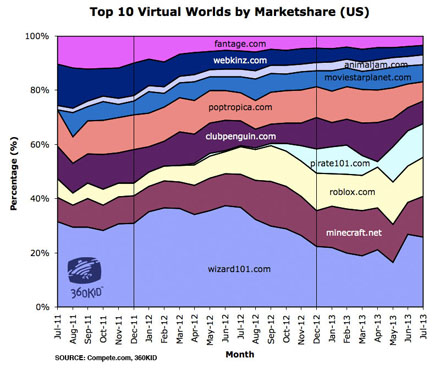
Chart 3 – Top 10 Tween Virtual Worlds – Percentage of Marketshare based on Unique Visitor Data. (Click image to see larger version of the chart.)
This marketshare chart above demonstrates how Wizard101, Pirate101, Minecraft and Roblox control almost 60% of the uniques combined for tween virtual worlds in the US. You can also notice some erosion with Webkinz and Fantage over time.
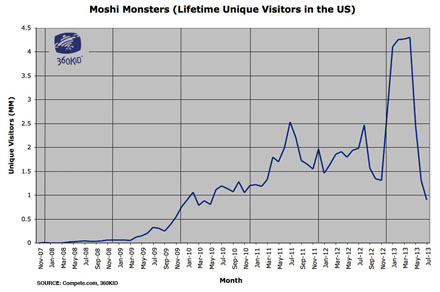
Chart 4 – Moshi Monsters – Lifetime Unique Visitor. (Click image to see larger version of the chart.)
Now let’s take a deeper look at Moshi Monsters. Why didn’t they place in the Top 10? The chart above shows the lifetime uniques for the destination within the US, more than five and a half years of data. You will notice that Moshi had a really great spring. Huge traffic! However, that traffic almost evaporated during the last two months. Let me remind you, the summer months in the US are a time for big numbers, not small. When this happens the first thing I often question is the validity of the Compete data for those months. The trouble is I’ve been using Compete for so long I’ve noticed they rarely get two months of back-to-back data wrong. It could happen, but I’m doubtful that’s the problem. Whatever the reason, it is a surprise to see after such a stellar rise in the spring.
These are just a few of the many stories that could be told with this data. There are many more stories to be told when you look at the data together with the hundreds of other worlds I follow as well. Especially when you break out the data by category (casual gaming, creative expression, education, sports, etc.) Do you see anything of interest with these charts? Do you see a story that needs to be told? If so, be sure to post a response in the comments section below. Thanks for reading!